These TV viewing statistics highlight how fast streaming is reshaping what people watch, where they watch it, and how much time they spend with TV and video each day.
tv viewing statistics
Key TV viewing statistics
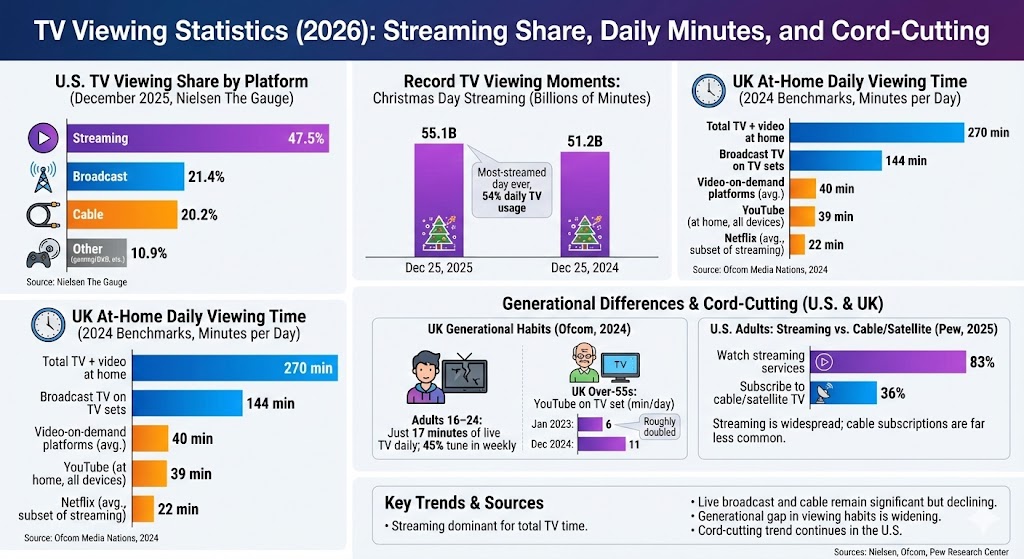
Streaming hit 47.5% of total U.S. TV viewing in December 2025 (Nielsen The Gauge).
Broadcast accounted for 21.4% and cable for 20.2% of U.S. TV viewing in December 2025 (Nielsen The Gauge).
On Christmas Day 2025, streaming reached 55.1 billion viewing minutes and 54% of daily TV usage (Nielsen).
In the UK, people spent 4 hours 30 minutes per day watching TV and video content at home in 2024 (Ofcom).
In the UK, broadcast TV still made up 56% of in-home viewing in 2024 (Ofcom).
In the U.S., 83% of adults say they watch streaming services, while 36% say they subscribe to cable or satellite TV (Pew Research Center, April 2025 survey).
U.S. TV viewing share by platform
Nielsen’s The Gauge provides a monthly snapshot of TV consumption on the television screen, including broadcast, cable, streaming, and other TV usage (e.g., gaming/DVD).
U.S. TV viewing breakdown (December 2025, share of TV)
Label
Bar
Value
Streaming
47.5%
Broadcast
21.4%
Cable
20.2%
Other (gaming/DVD, etc.)
10.9%
Max = 47.5%. Widths: Streaming 100.00%, Broadcast 45.05%, Cable 42.53%, Other (gaming/DVD, etc.) 22.95%.
Record TV viewing moments can spike streaming dramatically
Big event days can create unusually large shifts toward streaming. Nielsen reported that Christmas Day 2025 became the most-streamed day ever measured in The Gauge, with streaming taking 54% of daily TV usage and total streaming minutes surpassing the prior record set on Christmas Day 2024.
Streaming viewing minutes on Christmas Day (billions)
Label
Bar
Value
Dec 25, 2025
55.1B
Dec 25, 2024
51.2B
Max = 55.1B. Widths: Dec 25, 2025 100.00%, Dec 25, 2024 92.92%.
UK daily viewing time and the mix of services
Ofcom’s Media Nations reporting shows that TV sets remain central in the home, but viewing is increasingly split across broadcasters and online video platforms. The figures below are “at home” averages (and some measures overlap, such as Netflix being part of video-on-demand).
UK at-home viewing benchmarks (2024, minutes per day)
Label
Bar
Value
Total TV + video at home
270 min
Broadcast TV on TV sets
144 min
Video-on-demand platforms (avg.)
40 min
YouTube (at home, all devices)
39 min
Netflix (avg., subset of streaming)
22 min
Max = 270 min. Widths: Total TV + video at home 100.00%, Broadcast TV on TV sets 53.33%, Video-on-demand platforms (avg.) 14.81%, YouTube (at home, all devices) 14.44%, Netflix (avg., subset of streaming) 8.15%.
Generational differences in TV viewing
In the UK, adults aged 16–24 watched just 17 minutes of live TV daily (Ofcom, 2024).
In the UK, 45% of 16–24-year-olds tuned into broadcast TV weekly (Ofcom, 2024).
Ofcom also reported that over-55s roughly doubled their YouTube time on TV sets, reaching 11 minutes per day by December 2024 (from 6 minutes in January 2023).
UK over-55s: YouTube viewing on TV set (minutes per day)
Label
Bar
Value
Jan 2023
6
Dec 2024
11
Max = 11. Widths: Jan 2023 54.55%, Dec 2024 100.00%.
Cord-cutting and subscriptions in the U.S.
Survey data can help explain why platform share is shifting. Pew Research Center’s 2025 survey found that streaming use is widespread, while cable/satellite subscriptions are far less common among U.S. adults.
U.S. adults: streaming use vs. cable/satellite subscription (Pew, 2025)
Label
Bar
Value
Watch streaming services
83%
Subscribe to cable/satellite TV
36%
Max = 83%. Widths: Watch streaming services 100.00%, Subscribe to cable/satellite TV 43.37%.
FAQ
What counts as “TV viewing” in Nielsen’s The Gauge?
The Gauge is a monthly snapshot of viewing that occurs through a television screen and is reported across broadcast, cable, streaming, and other TV usage (such as gaming).
Why do UK time-based stats sometimes overlap?
Some Ofcom figures describe total at-home video time, while others break out specific formats or services (for example, Netflix is part of streaming/video-on-demand). These are best read as benchmarks rather than as parts of a single non-overlapping total.
Is cable TV “dead”?
Cable viewing remains significant in many markets, but the trend lines show audiences shifting toward streaming for both on-demand entertainment and increasingly for live events.
Sources
Nielsen (The Gauge press release, January 20, 2026): https://www.nielsen.com/news-center/2026/streaming-shatters-multiple-records-in-december-2025-with-47-5-of-tv-viewing-according-to-nielsens-the-gauge/
Ofcom (Published July 30, 2025; UK media habits / Media Nations): https://www.ofcom.org.uk/media-use-and-attitudes/media-habits-adults/tuning-into-youtube-uks-media-habits-revealed
Pew Research Center (July 1, 2025): https://www.pewresearch.org/short-reads/2025/07/01/83-of-us-adults-use-streaming-services-far-fewer-subscribe-to-cable-or-satellite-tv/