Smart TVs now sit at the center of streaming, advertising, and home entertainment. Below are key smart TV stats on ownership, viewing behavior, shipments, and platform share.
smart tv statistics
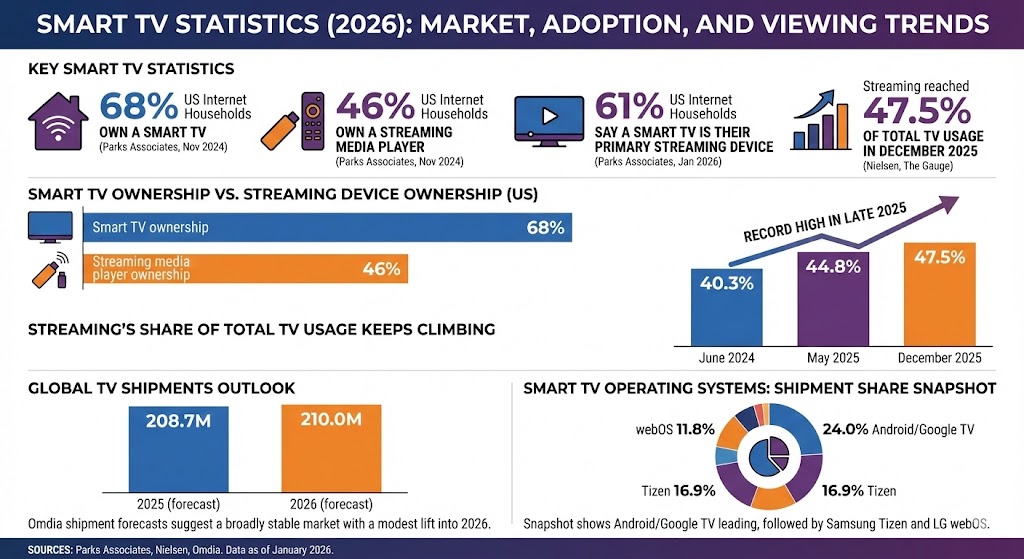
Key Smart TV Statistics
68% of US internet households own a smart TV (Parks Associates, November 2024).
46% of US internet households own a streaming media player (Parks Associates, November 2024).
61% of US internet households say a smart TV is their primary streaming device (Parks Associates, January 2026).
Streaming reached 40.3% of total TV usage in June 2024 (Nielsen, The Gauge).
Streaming reached 44.8% of total TV usage in May 2025 (Nielsen, The Gauge).
Streaming reached 47.5% of total TV usage in December 2025 (Nielsen, The Gauge).
Global TV shipments were forecast at about 208.7M in 2025 (Omdia forecast reported in industry press).
Global TV shipments were projected to exceed about 210M in 2026 (Omdia press release, December 2025).
Smart TV Ownership vs. Streaming Device Ownership (US)
Parks Associates data shows smart TVs are more common than standalone streaming media players in US internet households (November 2024).
Label
Bar
Value
Smart TV ownership
68%
Streaming media player ownership
46%
Max = 68%. Widths: Smart TV ownership 100.00%, Streaming media player ownership 67.65%.
Streaming’s Share of Total TV Usage Keeps Climbing
Nielsen’s monthly The Gauge reports show streaming gaining share over time, reaching a record high in late 2025.
Label
Bar
Value
June 2024
40.3%
May 2025
44.8%
December 2025
47.5%
Max = 47.5%. Widths: June 2024 84.84%, May 2025 94.32%, December 2025 100.00%.
Global TV Shipments Outlook
Omdia shipment forecasts suggest a broadly stable market, with a modest lift into 2026 and gradual gains thereafter.
Label
Bar
Value
2025 (forecast)
208.7M
2026 (forecast)
210.0M
Max = 210.0M. Widths: 2025 (forecast) 99.38%, 2026 (forecast) 100.00%.
Smart TV Operating Systems: Shipment Share Snapshot
This snapshot shows Android/Google TV leading, followed by Samsung Tizen, LG webOS, and Roku.