Twitch remains one of the world’s biggest live-streaming platforms, with massive daily viewership and millions of creators going live. Below are the latest Twitch TV statistics and trend snapshots using recent reporting and tracker dashboards.
twitch tv statistics
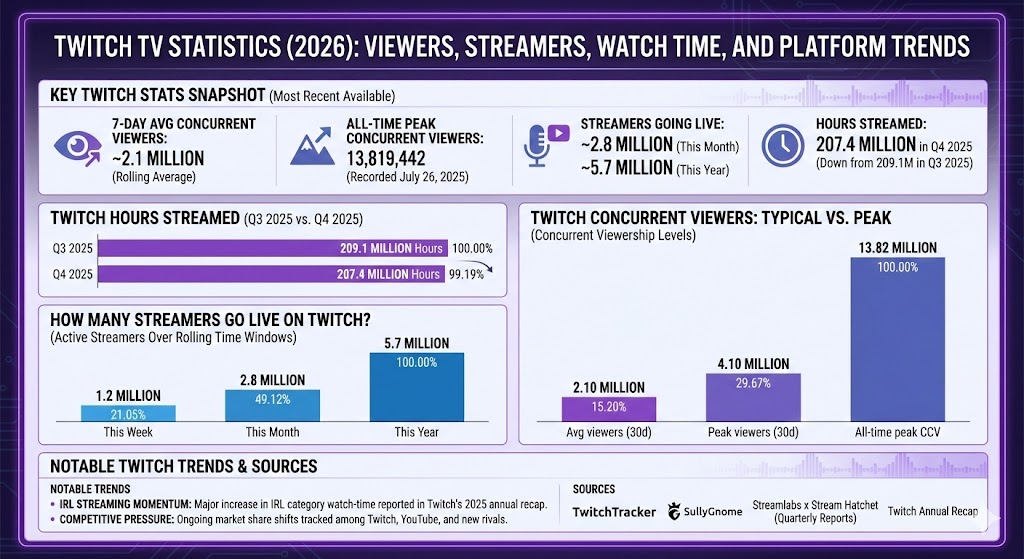
Key Twitch Stats Snapshot (Most Recent Available)
7-day average concurrent viewers: ~2.1 million (rolling average)
All-time peak concurrent viewers: 13,819,442 (recorded July 26, 2025)
Streamers going live: ~2.8 million (this month), ~1.2 million (this week), ~5.7 million (this year)
Hours streamed: 207.4 million in Q4 2025 (down from 209.1 million in Q3 2025)
Twitch Hours Streamed (Q3 2025 vs. Q4 2025)
Quarter
Share of Max (Bar)
Hours Streamed (M)
Q3 2025
209.1
Q4 2025
207.4
Max = 209.1. Widths: Q3 2025 100.00%, Q4 2025 99.19%.
How Many Streamers Go Live on Twitch?
Creator activity remains extremely high, with millions of unique streamers broadcasting over rolling time windows (week/month/year).
Active Streamers Over Rolling Time Windows
Window
Share of Max (Bar)
Streamers (M)
This week
1.2
This month
2.8
This year
5.7
Max = 5.7. Widths: This week 21.05%, This month 49.12%, This year 100.00%.
Twitch Concurrent Viewers: Typical vs. Peak
Twitch’s “average concurrent viewers” (rolling) is far below its all-time record peak, which was set in late July 2025.