TV advertising is shifting toward streaming and connected TV, but overall TV ad revenue remains sizable in many markets. Below are recent global, UK, and US benchmarks you can cite.
tv ad spend statistics
Key TV Ad Spend Statistics
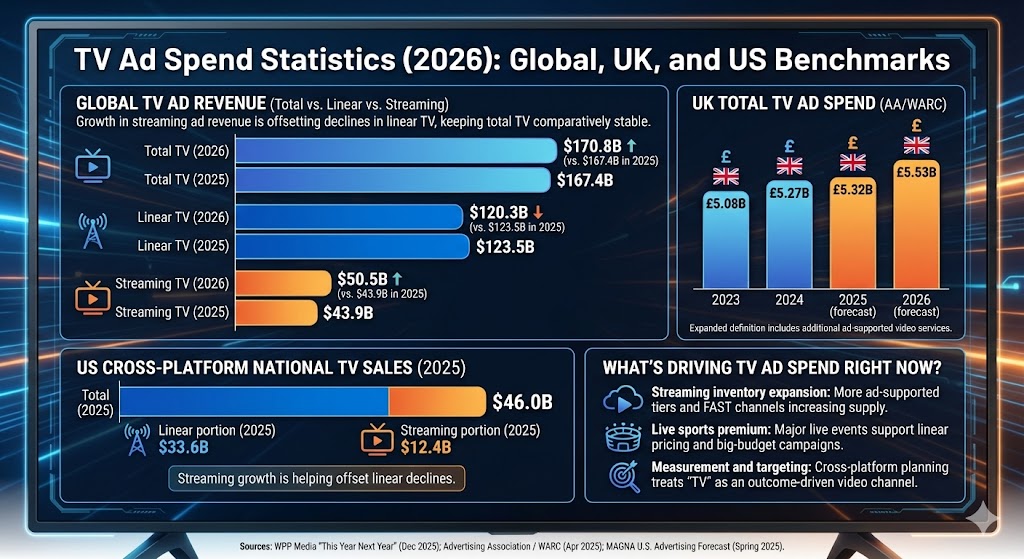
Global total TV ad revenue is projected at $170.8B in 2026 (vs. $167.4B in 2025).
Global streaming TV ad revenue is projected at $50.5B in 2026 (vs. $43.9B in 2025).
Global linear TV ad revenue is projected at $120.3B in 2026 (vs. $123.5B in 2025).
UK “Total TV” ad spend reached £5.27B in 2024 (AA/WARC definition expanded to include more ad-supported video services).
US cross-platform national TV sales (linear + streaming) are expected to be about $46B in 2025, with streaming helping offset linear declines.
Global TV Ad Revenue (Total vs. Linear vs. Streaming)
These figures show how growth in streaming ad revenue is offsetting declines in linear TV, keeping total TV comparatively stable.
Label
Bar
Value
Total TV (2026)
$170.8B
Total TV (2025)
$167.4B
Linear TV (2025)
$123.5B
Linear TV (2026)
$120.3B
Streaming TV (2026)
$50.5B
Streaming TV (2025)
$43.9B
Max = $170.8B. Widths: Total TV (2026) 100.00%, Total TV (2025) 98.01%, Linear TV (2025) 72.31%, Linear TV (2026) 70.43%, Streaming TV (2026) 29.57%, Streaming TV (2025) 25.70%.
UK Total TV Ad Spend (AA/WARC)
The UK’s “Total TV” category has been broadened to include additional ad-supported video services, making it a more comprehensive view of TV + premium streaming-style TV inventory.
US Cross-Platform National TV Sales (Linear + Streaming, 2025)
US “national TV” buying increasingly blends linear and streaming. MAGNA expects total cross-platform national TV sales to be about $46B in 2025, with streaming growth offsetting linear declines.
Label
Bar
Value
Total (2025)
$46.0B
Linear portion (2025)
$33.6B
Streaming portion (2025)
$12.4B
Max = $46.0B. Widths: Total (2025) 100.00%, Linear portion (2025) 73.04%, Streaming portion (2025) 26.96%.
What’s driving TV ad spend right now?
Streaming inventory expansion: More ad-supported tiers and FAST channels are increasing supply and making TV-like reach available outside traditional broadcast/cable.
Live sports premium: Live events remain one of the biggest supports for linear pricing and for big-budget TV campaigns.
Measurement and targeting: Cross-platform planning is pushing advertisers to treat “TV” as an outcome-driven video channel, not a single device.
Sources (for these specific figures)
WPP Media “This Year Next Year” (Dec 2025) figures as reported by Marketing Brew (global total TV, linear TV, streaming TV; 2025–2026).
Advertising Association / WARC Expenditure Report release (UK ad market; Total TV spend 2023–2026 forecast changes; Apr 2025).
MAGNA U.S. Advertising Forecast (Spring 2025 update; cross-platform national TV sales and streaming growth).