Streaming keeps expanding across TV and music, with record shares of viewing, hundreds of millions of subscribers on major platforms, and continued market growth projections.
streaming statistics
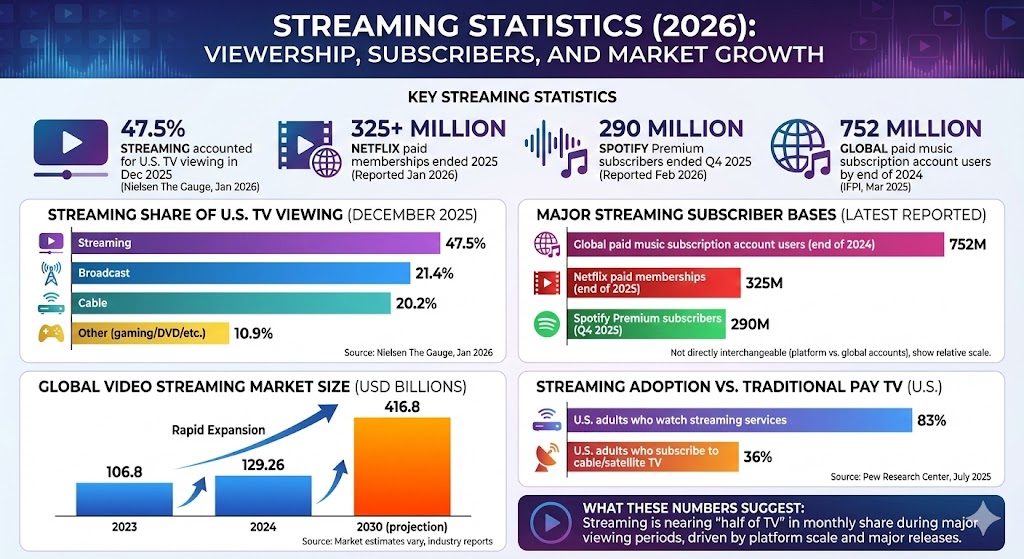
Key Streaming Statistics
Streaming accounted for 47.5% of U.S. TV viewing in December 2025 (Nielsen The Gauge, published January 2026).
Netflix ended 2025 with 325+ million paid memberships (reported January 2026).
Spotify ended Q4 2025 with 290 million Premium subscribers (reported February 2026).
Global paid music subscription account users reached 752 million by the end of 2024 (IFPI Global Music Report 2025, published March 2025).
83% of U.S. adults say they watch streaming services, while 36% say they subscribe to cable or satellite TV (Pew Research Center, July 2025).
Streaming Share of U.S. TV Viewing (December 2025)
Nielsen The Gauge (Dec 2025) reported streaming at 47.5% of TV viewing; broadcast was 21.4% and cable was 20.2%. “Other” is the remainder.
Label
Bar
Value
Streaming
47.5%
Broadcast
21.4%
Cable
20.2%
Other (gaming/DVD/etc.)
10.9%
Max = 47.5%. Widths: Streaming 100.00%, Broadcast 45.05%, Cable 42.53%, Other (gaming/DVD/etc.) 22.95%.
Major Streaming Subscriber Bases (Latest Reported)
This compares three widely cited “scale” figures across streaming categories (video and music). Note that these are not directly interchangeable (platform subscriptions vs. global paid accounts), but they help show relative scale.
Label
Bar
Value
Global paid music subscription account users (end of 2024)
752M
Netflix paid memberships (end of 2025)
325M
Spotify Premium subscribers (Q4 2025)
290M
Max = 752M. Widths: Global paid music subscription account users (end of 2024) 100.00%, Netflix paid memberships (end of 2025) 43.22%, Spotify Premium subscribers (Q4 2025) 38.56%.
Global Video Streaming Market Size (USD Billions)
Market estimates vary by definition, but many industry reports show rapid expansion for streaming video over the decade.