These TV market statistics summarize major market signals—overall revenue outlook, recent shipment movement, and how premium display technologies like OLED are shaping competition.
tv market statistics
Key TV market statistics (latest available)
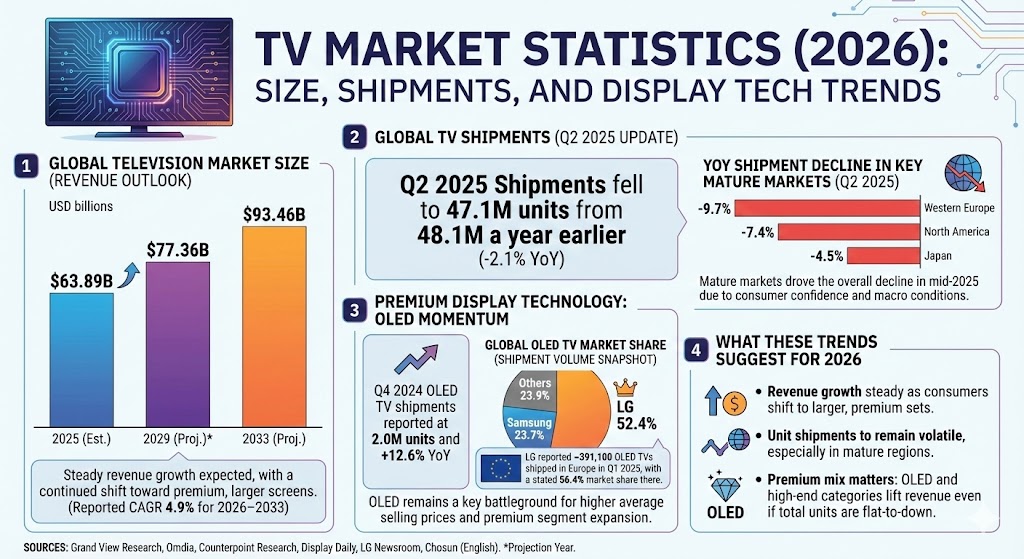
Global television market size (revenue): Estimated at $63.89B (2025) and projected to reach $93.46B by 2033 (reported CAGR 4.9% for 2026–2033).
Global TV shipments: In Q2 2025, shipments fell to 47.1M units from 48.1M a year earlier (-2.1% YoY).
Where the Q2 2025 shipment weakness came from: Mature markets declined—Western Europe -9.7%, North America -7.4%, Japan -4.5% (YoY).
OLED TV momentum: Q4 2024 OLED TV shipments were reported at 2.0M units and +12.6% YoY.
Europe OLED share (brand claim): LG reported shipping about 391,100 OLED TVs in Europe in Q1 2025, with a stated 56.4% market share there.
Global TV market size outlook
Across common industry forecasts, TV revenue growth is generally expected to be steady rather than explosive, with a continued tilt toward higher-value sets (larger screens, better panels, smarter platforms) even when unit volumes fluctuate.
TV Market Statistics Chart: Global Television Market Size (USD billions)
Year
Bar
Value
2025
63.89
2029*
77.36
2033
93.46
Max = 93.46. Widths: 2025 68.36%, 2029* 82.78%, 2033 100.00%.
TV shipments: mature markets drove declines in mid-2025
Unit shipments can swing based on consumer confidence, replacement cycles, and regional demand. In Q2 2025, declines in several mature markets were highlighted as major contributors to a softer global result.
TV Market Statistics Chart: YoY Shipment Decline in Key Mature Markets (Q2 2025)
Market
Bar
Value
Western Europe
-9.7%
North America
-7.4%
Japan
-4.5%
Max = 9.7%. Widths: Western Europe 100.00%, North America 76.29%, Japan 46.39%.
Premium display technology: OLED remains a key battleground
Even when the broader market is choppy, premium segments can expand via higher average selling prices. OLED continues to be a major focus, and reported shipment-share snapshots show a concentrated competitive landscape.
TV Market Statistics Chart: Global OLED TV Market Share (Shipment Volume Snapshot)
Brand/Group
Bar
Value
LG
52.4%
Samsung
23.7%
Others
23.9%
Max = 52.4%. Widths: LG 100.00%, Samsung 45.23%, Others 45.61%.
What these trends suggest for 2026
Revenue growth is expected to be steady as consumers continue shifting toward larger and more premium sets over time.
Unit shipments can remain volatile, especially across mature regions where replacement cycles and macro conditions drive swings.
Premium mix matters: OLED and other high-end categories can lift revenue even if total units are flat-to-down.
Sources
Grand View Research – Television market size and forecast (2025 estimate; 2033 projection; CAGR).
Omdia (Informa Tech) – Global TV shipments Q2 2025; regional declines (Western Europe, North America, Japan).
Counterpoint Research – Global Monthly TV Shipments Tracker (late-2025 shipment trend reference).
Display Daily (citing Omdia) – Q4 2024 OLED TV shipments and YoY growth.
LG Newsroom – Europe OLED shipment and market share claim (Q1 2025).
Chosun (English) – OLED TV shipment-share snapshot (Samsung vs LG).